01
Broken Margin Stack
Distributor take, shelf fees, freight, and deductions surface margin pressure that only looked acceptable on paper.
Distribution / CPG / Vendor Side
For brands already inside KeHE or UNFI: PRO diagnoses whether supplier readiness, deductions, chargebacks, scorecard pressure, OTIF penalties, fill-rate performance, and promo-driven volume can support more capital.
Distributor take, shelf fees, freight, and deductions surface margin pressure that only looked acceptable on paper.
When scan-downs stop, sales disappear; volume is being bought, not earned.
Bill-backs, fines, and launch charges get normalized until the loss is material.
More DCs before proof compounds the operating gap and burns capital faster.
Sales that disappear without promotional support are subsidies, not durable demand.
DC-level execution swings make consolidated P&L unreliable across the footprint.
Distribution Diagnostics Pro is an operator-grade commercial diagnostic for active KeHE and UNFI suppliers. It surfaces whether the model is profitable, scalable, and stable — or sensitive to channel complexity.
Output: Go / Constrain / Stop.
Most supplier losses do not show up as one clean line item. PRO reviews visible exposure categories first; scoring, weights, and full review stay inside qualified engagements.
Off-invoice programs, billbacks, and recovery gaps that distort net contribution.
Trade spend, scan-downs, and allowances that fail to create durable reorders.
Short ships, late performance, and fill-rate pressure that become deductions.
Documentation, transmission, labeling, and receiving friction that create exposure.
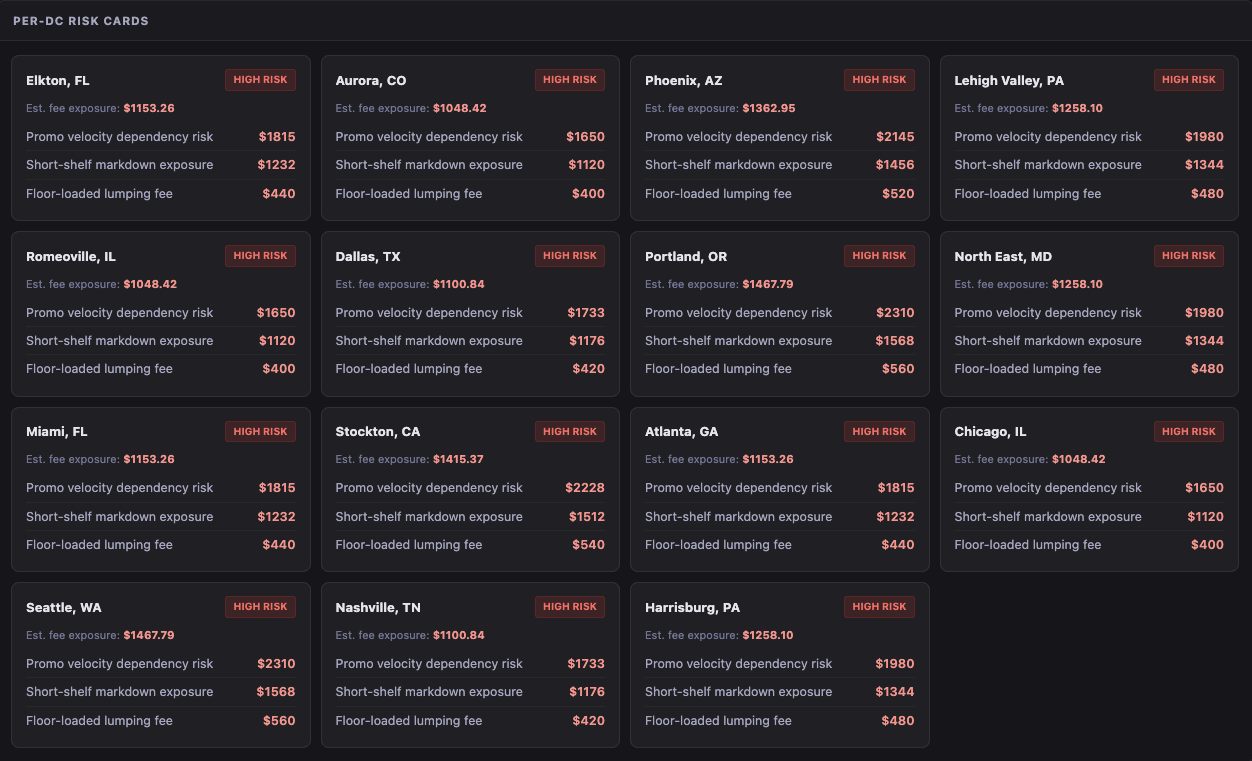
Routing, carrier, temperature, and handling issues that compress landed margin.
Spoils, unsaleables, claims, and recurring deductions that become normalized.
Performance decay that weakens account posture and raises growth cost.
Program, launch, shelf, or access costs tested against reorder economics.
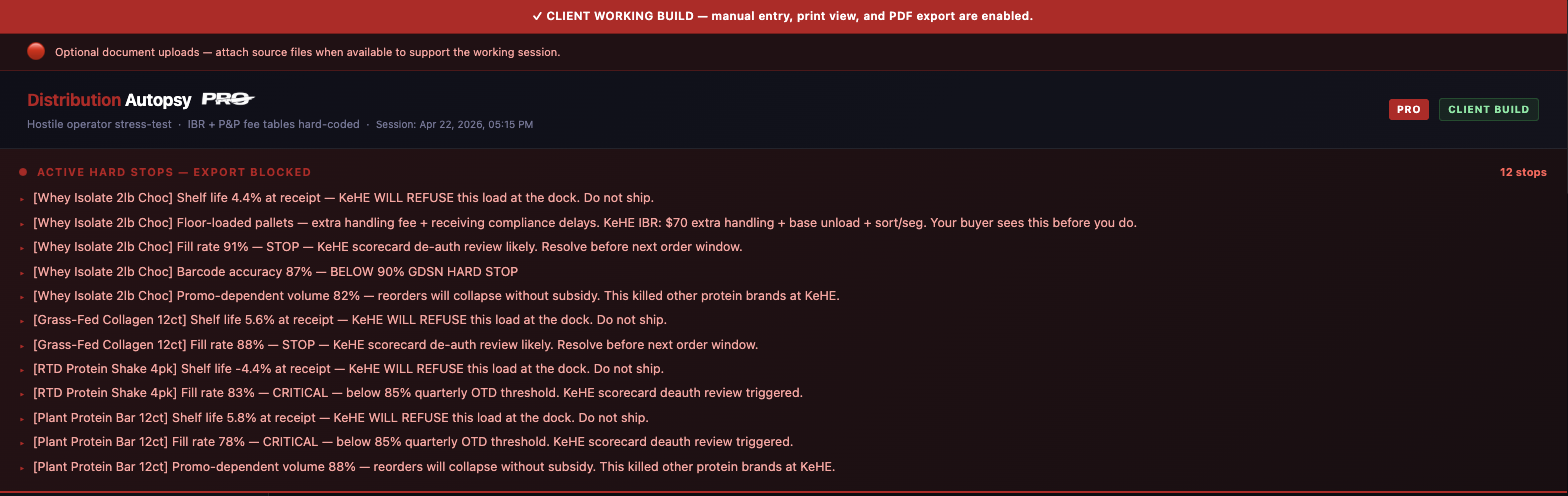
Where deductions, chargebacks, scorecard pressure, OTIF penalties, and fill-rate gaps become visible.
Flags shipment exposure before it becomes receipt pressure, deductions, chargebacks, or conditional review.
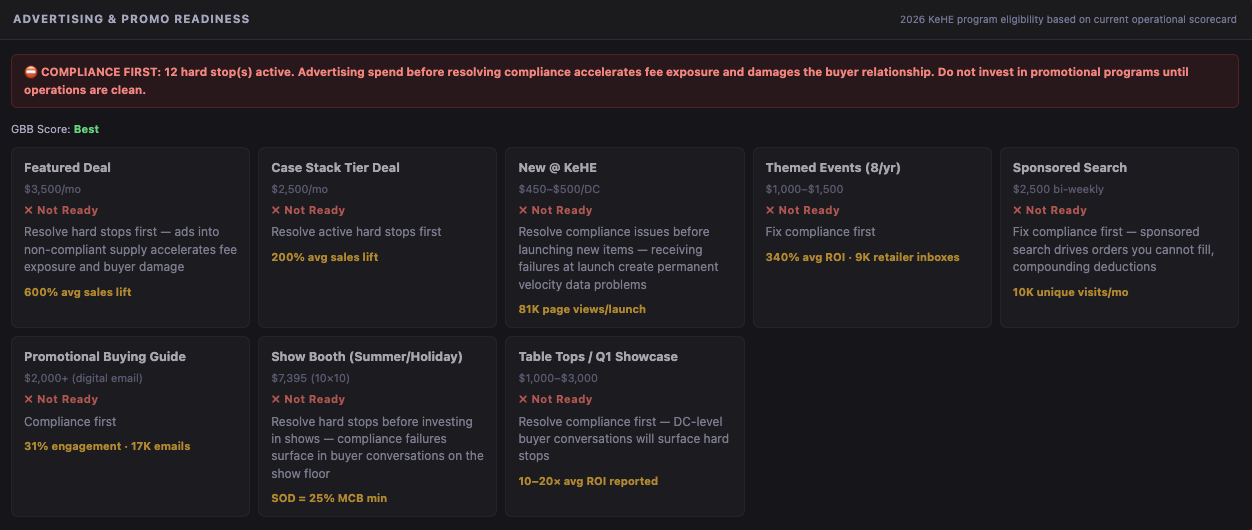
Shows where GBB, scorecard, and promo readiness are helping the brand — or limiting it.
Separates real demand from subsidized movement and measures recovery.
Organizes cost sheets, deductions, velocity, and compliance records into evidence.
Most suppliers review incidents. PRO diagnoses the system before expansion compounds the operating gap.
Economics hold, promo spend is recoverable, deductions are controllable, and velocity justifies continued investment.
The model can work, but promo architecture, deductions, or fee stack terms must be corrected before expansion continues.
The current structure is not viable. Stop or reconstruct the distributor path before more capital deepens the loss.
Full diagnostic outputs are reviewed during a booked diagnostic call.
KeHE Connect reports activity. PRO explains the financial meaning.
Booked diagnostic calls receive the diagnostic environment with full input review.
Built for active KeHE and UNFI suppliers who need the economics confronted directly: promo dependence, deduction pressure, margin compression, and fee exposure. Not a fit if you want findings softened or assumptions blessed.
$382K
Cash burn avoided
$142K
MCB recovery
Top 15%
Compliance rank
Three supplier engagements across complex distributor channels. Different operating gaps, same finding: the economics were not yet durable before scale. PRO surfaced the issue before losses compounded.
Series A brand secured four distributor DC authorizations before auditing economics. PRO surfaced negative contribution risk, pivoted to a two-DC pilot, and rebuilt landed-margin architecture.
The fastest-moving SKU was losing $0.37 per case. MCBs were unmapped, trade spend was 29.4%, and promo had become the only lever.
Brand entered a major natural/specialty distributor channel, then accumulated $142K in chargebacks. No compliance owner, chronic fill-rate gaps, and de-authorization risk were all in play.
Enter three numbers. PRO returns a directional exposure estimate, scorecard health preview, and the likely pressure points inside your channel model.
Enter all three inputs to surface your exposure profile.
This preview is directional. It does not surface PRO’s full scoring model, fee-stack weights, or diagnostic review logic. Full analysis is reserved for qualified engagements.
No external data is pulled.
Fast first-pass review.
Deep review of fee stack, deductions, promo dependence, DC complexity, and execution gaps.
Operator-led follow-through on the highest-cost issues.
Distribution Diagnostics Pro isolates the economics and produces a commercial decision output. It tells you whether the current KeHE or UNFI path deserves more capital — or whether it should be stopped and rebuilt.
Prefer email? hello@primeretailops.com